Reporting & analytics

Reach the goals of your company through data

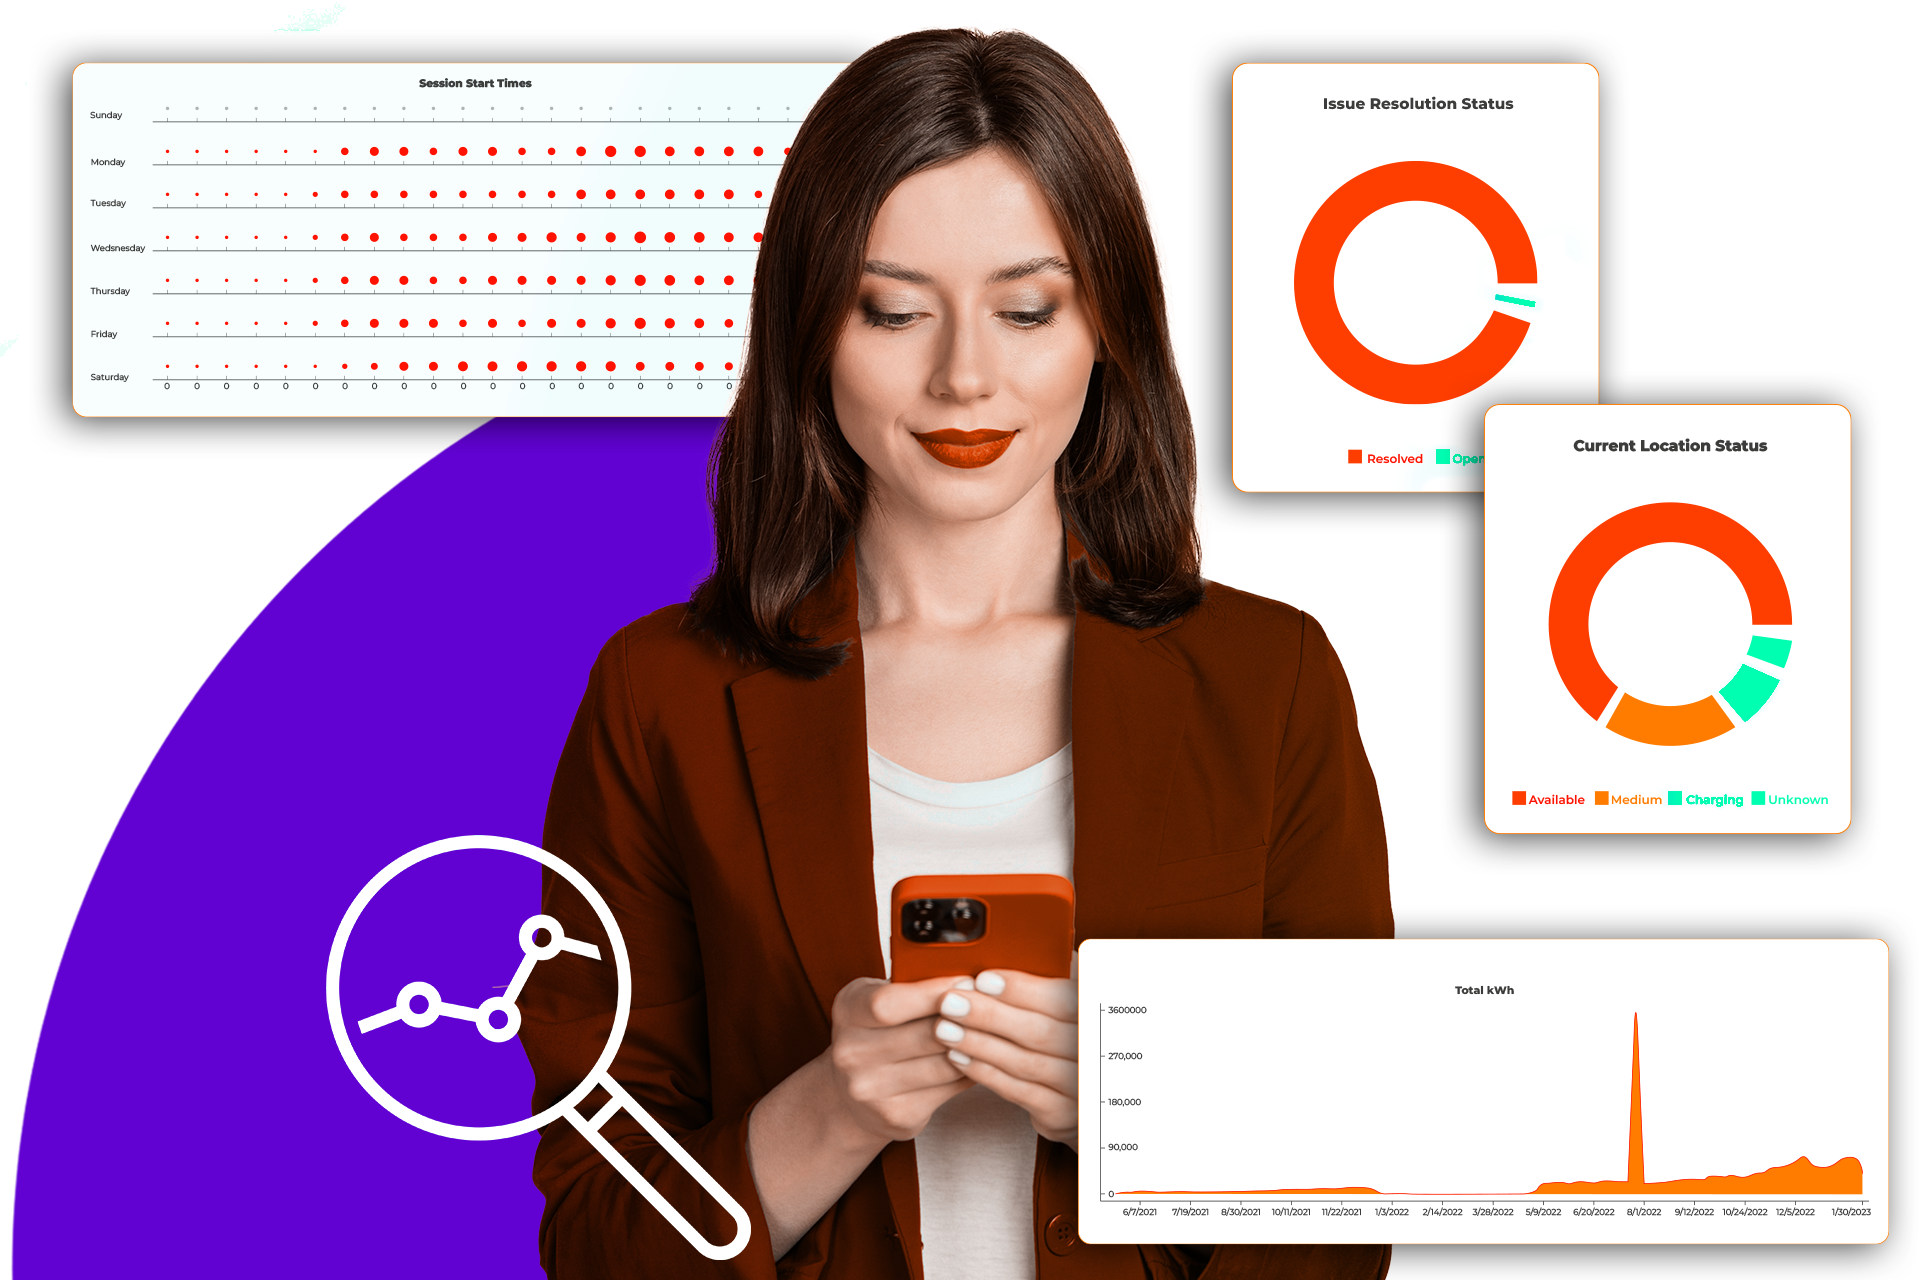
All your data is displayed in an analytics dashboard. View how much CO2 you’ve saved, and which stations are used most often for charging. You have insight into all your data, which is made to be comprehensible. Give your partners access to locational data that they need for building their business case.

Get in touch
Icoonset E-Flux by Road in donkeroranje, voor analyse en rapportage.

Insight into all data

From CO2 savings, to charging sessions.

Icoonset E-Flux by Road in donkeroranje, voor eenvoudig gebruik.

Easy to use

See your own data displayed in graphs.

Icoonset E-Flux by Road in donkeroranje, altijd up-to-date.

Always up to date

Data gets live updates.

Icoonset E-Flux by Road in donkeroranje, flexibel.

Flexibility

Import data to your own systems through our APIs.

Are you ready to take
the next step with E-Flux?

Get in touch